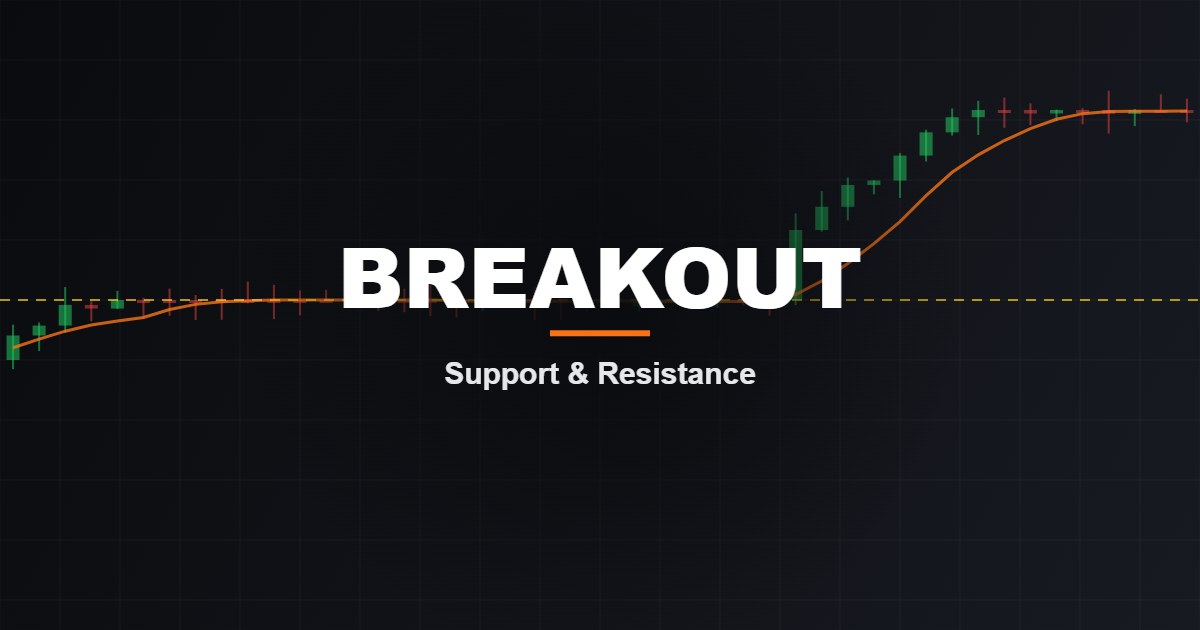
Breakouts look easy on a finished chart: price breaks resistance and flies. In real time, many breakouts reverse straight back into the range and stop out everyone who bought the break. That trap is called a fakeout, and it is the main reason breakout traders struggle.
This breakout trading strategy focuses on what professional price action traders do differently: they draw levels as zones, judge the quality of the breakout candle, and usually wait for the retest instead of chasing.
Key takeaways
- Draw support and resistance as zones on higher timeframes, not as single thin lines.
- A real breakout usually closes decisively beyond the zone with a strong candle body.
- The break-and-retest entry gives a better price and a clearer stop than buying the breakout candle.
- If price closes back inside the range, the breakout has failed. Get out.
Step 1: Draw support and resistance correctly
- Start on a higher timeframe. Mark levels on the daily and H4 charts first, then move down to H1 for entries.
- Use zones. Draw a box around the area where price turned several times, from the candle bodies to the wicks.
- Look for multiple touches. A level touched two or three times is more meaningful than one touched once.
- Note round numbers. Levels like 1.1000 or 150.00 often attract orders.
Step 2: Tell a real breakout from a fakeout
Signs of a stronger breakout:
- The candle closes clearly beyond the zone with a large body and small wicks.
- Price was compressing in a tight range just before the break, building pressure.
- The break is in the same direction as the higher-timeframe trend.
- It happens during an active session, such as the London or New York open.
Warning signs of a fakeout:
- A long wick through the level but a close back inside the range.
- The break runs straight into another higher-timeframe level just above or below.
- The move is a spike during a news release with no follow-through.
- The break is against a strong higher-timeframe trend.
Step 3: The break-and-retest strategy
When resistance breaks, it often becomes support (and broken support often becomes resistance). The retest of that flipped level is where many disciplined traders enter.
Rules (bullish breakout)
- Context: the daily or H4 trend is up, and a clear resistance zone has been tested at least twice.
- Breakout: an H1 candle closes decisively above the resistance zone.
- Retest: wait for price to pull back into the top of the broken zone.
- Entry: enter when a bullish rejection candle (pin bar or bullish engulfing) closes at the retest.
- Stop-loss: below the retest low, with a small buffer (for example 0.5 × ATR).
- Target: the next resistance zone, as long as it is at least 2R away. If it is closer, skip the trade.
- Invalidation: if an H1 candle closes back below the zone, exit. The breakout has failed.
For bearish breakouts, flip the rules: support breaks, price retests it from below, and you sell the bearish rejection.
Breakout entry vs retest entry
| Enter on the break | Enter on the retest | |
|---|---|---|
| Catches every move | Yes | No, some breakouts never retest |
| Entry price | Often stretched | Better, closer to the level |
| Stop placement | Wide, back inside the range | Tighter, below the retest |
| Fakeout risk | Higher | Lower, the level has been tested |
Missing a few trades that never retest is the price you pay for avoiding many fakeouts. For most traders, that is a good deal.
Advanced: trading the failed breakout
When a breakout fails and price closes back inside the range, traders who bought the break are now trapped. Their stop-losses can push price quickly to the other side of the range. Some traders deliberately trade this: after a clear close back inside, they enter toward the opposite side of the range with a stop beyond the fakeout wick. This is more advanced, so practise it on demo first.
Common breakout mistakes
- Drawing too many levels until every candle seems to “break” something.
- Buying a breakout that is already far from the level.
- Ignoring the next level: a breakout with only 10 pips of room is not worth the risk.
- Risking too much on one setup. Use proper position sizing.
Breakouts combine well with trend tools. An EMA trend filter keeps you on the right side, and RSI can show whether momentum supports the break.
Breakout trading FAQ
What is the best timeframe for breakout trading?
Mark levels on H4 and daily, and time entries on H1 or M15. Breakouts of higher-timeframe levels tend to be more meaningful than breakouts on M1 or M5.
How do I know if a breakout is real?
No method is certain, but a strong candle close beyond the zone, compression before the break, and alignment with the higher-timeframe trend all improve the odds. A close back inside the range is the clearest sign it has failed.
Should I trade breakouts during news?
News spikes often create fakeouts and wide spreads. Most traders wait until the news candle has closed and the market settles before judging a breakout.
This article is for education only and is not financial advice. Trading Forex carries a high risk of loss. Read our Risk Disclaimer.