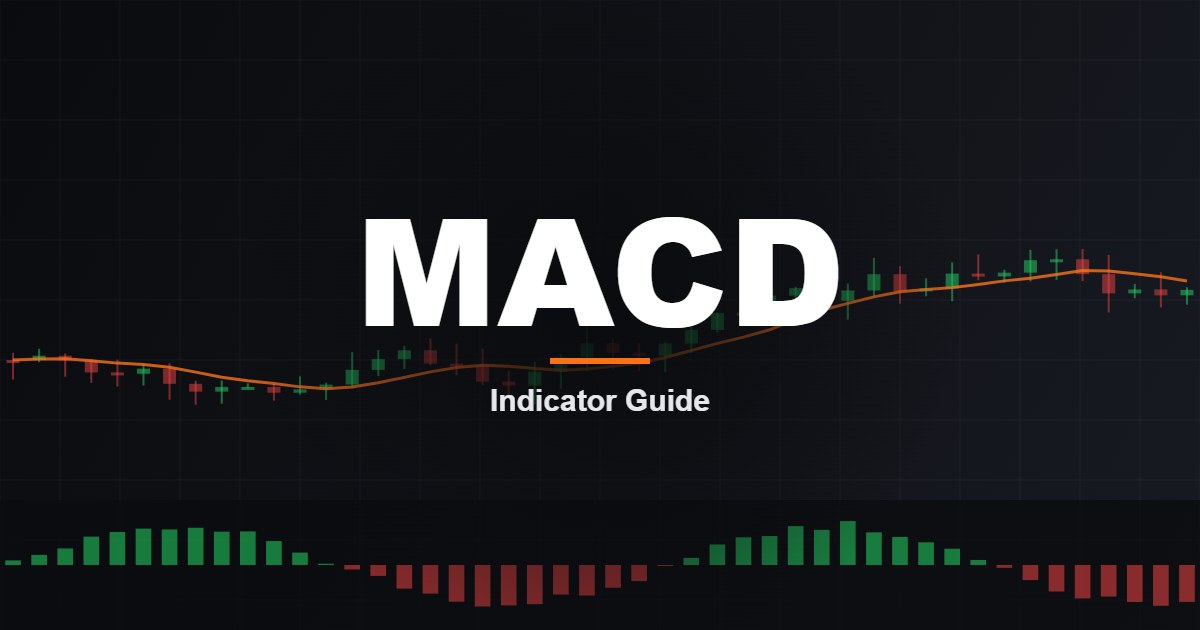
The MACD indicator looks complicated at first: two lines, a histogram and a zero line. But once you understand what each part is telling you, MACD becomes one of the most useful tools for reading trend direction and momentum on any Forex chart.
This guide explains how MACD is calculated in plain English, the four signals it gives, why the classic crossover fails so often, and a simple MACD trend strategy with clear rules.
Key takeaways
- MACD shows the gap between a fast and a slow moving average, so it measures trend and momentum.
- The zero line is the most underrated part: above zero favours buys, below zero favours sells.
- Signal-line crossovers work well in trends and poorly in sideways markets.
- Histogram divergence at a key level is one of MACD’s most reliable warning signs.
What is the MACD indicator?
MACD stands for Moving Average Convergence Divergence. It was developed by Gerald Appel in the late 1970s and has three parts:
- MACD line: the 12-period EMA minus the 26-period EMA. When the fast average pulls away from the slow one, momentum is increasing.
- Signal line: a 9-period EMA of the MACD line. It smooths the MACD line and is used for crossover signals.
- Histogram: the MACD line minus the signal line, shown as bars. Growing bars mean momentum is accelerating; shrinking bars mean it is slowing.
Best MACD settings
The standard setting is 12, 26, 9, and it is a sensible default on most timeframes. Faster settings such as 8, 17, 9 react sooner but give more false signals. Changing settings will not turn a weak strategy into a good one, so most traders are better off keeping the default and improving their rules instead.
The 4 MACD signals explained
1. Signal-line crossover
When the MACD line crosses above the signal line, short-term momentum is turning up. A cross below suggests momentum is turning down. This is the most popular signal and also the most overused.
2. Zero-line position
When the MACD line is above zero, the 12 EMA is above the 26 EMA, which means the short-term trend is up. Below zero, the short-term trend is down. Many experienced traders use the zero line simply as a trend filter.
3. Histogram momentum
The histogram shows whether momentum is speeding up or slowing down. If price makes a new high but the histogram bars are getting smaller, the move is losing energy.
4. Divergence
Bearish divergence forms when price makes a higher high while MACD (or its histogram) makes a lower high. Bullish divergence forms when price makes a lower low while MACD makes a higher low.
Why most MACD crossover trades fail
MACD is built from moving averages, so it lags price. In a clean trend this lag is fine. In a sideways market the lines cross back and forth every few candles, and every crossover becomes a small loss. The trick professionals use is simple: only take crossovers in the direction of the zero line, and skip them completely when price is chopping inside a range.
A simple MACD trend strategy
This strategy combines the zero line as a trend filter with a crossover as the entry trigger. It works on H1 and H4 charts for most major pairs.
Rules (long trade)
- Trend: price is above the 200 EMA and the MACD line is above zero.
- Pullback: price pulls back toward the 50 EMA or a support level, and the MACD line dips below the signal line while staying above zero.
- Entry: the MACD line crosses back above the signal line and a bullish candle closes.
- Stop-loss: below the pullback swing low.
- Exit: take partial profit at 2R, then trail the rest below the 20 EMA or exit when MACD crosses below zero.
For short trades, reverse the rules: price below the 200 EMA, MACD below zero, and enter when the MACD line crosses back below the signal line after a rally.
Trading MACD histogram divergence
Histogram divergence is often the earliest warning that a trend is running out of fuel. To make it more reliable:
- Only trade it at a major higher-timeframe support or resistance level.
- Wait for price to break the last minor swing in the new direction before entering.
- Place your stop beyond the extreme high or low.
- Expect a pullback or range first. Divergence does not always mean a full reversal.
MACD vs RSI
MACD is better at showing trend direction and the strength of a move. RSI is better at showing short-term stretch and pullback zones. Many traders use MACD for direction and RSI for timing entries. Avoid stacking too many oscillators, though: they are built from the same price data and often say the same thing.
Common MACD mistakes
- Taking every crossover, including those against the trend.
- Using MACD in tight ranges where it whipsaws.
- Treating divergence as an instant reversal signal.
- Ignoring position size. Read our guide to Forex position sizing before trading any strategy.
MACD indicator FAQ
What are the best MACD settings for a 15-minute chart?
The default 12, 26, 9 works well on M15. Some day traders use 8, 17, 9 for faster signals, but they should add a trend filter such as the 200 EMA to avoid whipsaws.
Is MACD a leading or lagging indicator?
MACD is mainly lagging because it is built from moving averages. Its histogram and divergence signals can give earlier warnings, but they still need price confirmation.
Can MACD be used for scalping?
It can, but on very low timeframes MACD produces many false crossovers. Scalpers usually take MACD signals only in the direction of the higher-timeframe trend.
This article is for education only and is not financial advice. Trading Forex carries a high risk of loss. Read our Risk Disclaimer.